

Return on Investment for Organizational Learning

Guest Column | Originally Published on August 11, 2025 | Published with permission
This blog introduces a simple model to estimate your organization’s “problem burden,” shows what a modest investment in organizational learning can return, and argues that the smartest money you’ll ever spend might not be on better equipment or more headcount — but on better learning.
My background is in accounting and corporate finance, and from that perspective there’s a big gap between the idea of a cost driver and an investment.
On an income statement, functions like Safety, Quality, Reliability, and IT Service Management usually show up as expenses that don’t directly contribute to the top line. They’re often treated like cost centers — or worse, like unavoidable taxes — whose main value is checking a compliance box or adding some corporate window dressing.
That’s not entirely the fault of business leaders. The truth is, the people in Safety, Quality, Reliability, and ITSM roles often speak in the language of incidents, root causes, and compliance requirements — but not in the language of money.
And that’s okay. These roles should focus on the qualitative benefits — because in many cases, those benefits outweigh the dollars. Who really thinks reducing human life, wellbeing, or environmental stewardship to an actuarial table is a good idea? The human element matters.
At the same time, let’s not pretend business leaders only care about the financials. Most leaders care deeply about their people, their customers, and their company’s role in the community. But they also have a responsibility to steward resources wisely and make decisions that balance compassion with sustainability.
That’s why we need to bring both sides together. We need the emotional awareness that values people, and the financial awareness that drives long-term investment. As you’ll see, our position is simple: most companies are dramatically underinvesting in their learning capability — and closing that gap is one of the most high-impact decisions a leadership team can make.
The Problem Burden
Every organization carries what I call a Problem Burden— the measurable cost of preventable issues. It’s not just one big number. It’s built up from hundreds or thousands of individual events, each of which leaves a financial and operational fingerprint.
Each event can have multiple impacts. For example:
A single equipment failure might cause downtime in production, trigger a regulatory report, delay customer orders, and require supplier rework.
A safety incident might also hurt employee morale, slow throughput, and generate reputational risk.
That means every event is like a mutual fund share— a bundle containing pieces of several underlying “assets,” which in this case are your impact areas:
Safety
Environmental
Quality
Reliability
Production
Reputation
Regulatory
Customer
Supplier
Employees
When you roll these events up across the organization, you can follow the Problem Burden hierarchy much like an asset hierarchy in FMEA. At the base are the events themselves. Above that, you group them by department, plant, or functional area. At the top sits the corporate total, which reflects contributions from every corner of the business.
This matters because multiple functions often share the same burden from the same events — but unless you measure it that way, you’ll never see the overlap.
And this is why it’s critical to involve different stakeholders when solving problems. Each has an interest in reducing the burden, but too often problems get bucketed and assigned to a single category: “That’s a safety problem” or “That’s a quality problem.” In reality, most significant events cross boundaries. Recognizing this — and addressing problems holistically — is where real progress begins.
North River Industrial – A Case in Numbers
To make this concept concrete, let’s look at a hypothetical (but very realistic) example.
North River Industrial is a mid-sized manufacturer with operations spread across several U.S. states. They produce high-value, precision-engineered components for the transportation, energy, and heavy equipment industries. Their customer base is diverse, but their success depends on hitting tight delivery schedules, maintaining exceptional product quality, and keeping a spotless safety and environmental record.
North River employs about 5,000 people and generates roughly $2.2 billion in annual revenue. They’ve been in business for decades and are respected in their sector. But like most companies, they face ongoing operational friction — incidents, failures, and setbacks that consume time, money, and focus.
When we calculate their Problem Burden, the result is eye-opening. Even without any major disasters, their “normal” annual drag on performance — spread across Safety, Environmental, Quality, Reliability, Production, Reputation, Regulatory, Customer, Supplier, and Employee impact areas — adds up to $30.25 million a year.
For North River, that $30.25 million a year is simply “the cost of doing business.” But as we’ll see, the cost to meaningfully reduce that burden is far less than most executives assume.
North River Industrial – Annual Problem Burden
Annual Revenue: USD $2.2B
Total Problem Burden: USD $30.25M (≈1.4% of revenue)
Conservative estimate; excludes major “black swan” events.
Impact Area | Description of Burden | Estimated Annual Cost | % of Total Burden |
Safety | Medical costs, workers’ comp, lost time, investigations | $5,000,000 | 16.5% |
Environmental | Fines, cleanup costs, compliance interventions | $1,500,000 | 5.0% |
Quality | Scrap, rework, warranty claims, returns | $6,000,000 | 19.8% |
Reliability | Equipment failures, unplanned downtime | $4,000,000 | 13.2% |
Production | Throughput loss, overtime, scheduling disruption | $5,000,000 | 16.5% |
Reputation | Lost sales, brand damage, negative media | $2,000,000 | 6.6% |
Regulatory | Penalties, legal costs, mandated changes | $1,000,000 | 3.3% |
Customer | Lost contracts, service level failures | $3,000,000 | 9.9% |
Supplier | Expedited sourcing, supplier quality failures | $1,250,000 | 4.1% |
Employees | Turnover, morale loss, disengagement | $1,500,000 | 5.0% |
| Total: | $30,250,000 |
|
And there’s another dimension to this conversation — one that rarely shows up on a financial statement: risk.
Every one of the ten problem-burden categories at North River carries not only the actual cost of the incident, but also the risk of a much worse outcome. The production delay that “only” cost a few thousand dollars could have triggered a major customer loss. A minor safety injury could have been a fatality. A quality escape that slipped past inspection could have reached a critical customer or triggered a recall.
Think of the actual outcome as the inner ring of a target — that’s what happened this time. But surrounding it are larger rings representing plausible “what ifs” that could have just as easily occurred under slightly different circumstances. That’s the potential blast radius.

We don’t need to turn this blog into a deep dive on risk calculations, but it’s worth noting: investing in organizational learning isn’t just about reducing the costs you can see on last quarter’s balance sheet — it’s also about shrinking that blast radius so the bad days don’t become catastrophic days.
The Overlap Problem
Looking at North River’s problem burden as ten neat categories is useful for sizing the challenge — but it hides something important.
In reality, most incidents don’t stay in one lane. Think of an event as a mountain lake high in the hills. From that lake, multiple drainages flow into different valleys. One stream might represent safety costs, another production losses, another reputational hit. They all start from the same source, but they end up flowing into different parts of the business.
For example:
A production line failure (the “lake”) might cause missed shipments (Customer), overtime costs (Production), and expedited parts from a supplier (Supplier).
A safety incident might trigger regulatory reporting (Regulatory), lower morale (Employees), and a temporary loss in throughput (Production).
A quality escape might require rework (Quality) while also straining a customer relationship (Customer) and prompting an audit (Regulatory).
When we label these events as just a “safety problem” or a “quality problem,” we undercount the impact. The true cost is the sum of all those drainages — not just the one you happen to be standing next to.
Recognizing this interconnectedness changes how you solve problems. If a single event ripples across five different areas, you need people from all five at the table — not just the department that drew the short straw.
The Investment Side
So, what does it cost to build the capability to meaningfully reduce North River’s $30.25M annual problem burden?
We use a tiered capability model when designing organizational learning programs:
Apprentice (Level 1) — Everyone in the organization learns how to recognize, report, and contribute to learning from events. This is active, hands-on training that reinforces each employee’s role in building a safer, more reliable organization.
Specialist (Level 2) — Roughly 10% of employees are trained to credibly lead investigations and formal learning events.
Master (Level 3) — About 10% of Specialists receive advanced training to mentor others, ensure quality, and lead the most complex, high-value events.
Program Champion — One person (or a very small team) provides overall leadership, governance, integration, and continuous improvement for the program.
Executives — Senior leaders need targeted training on their role in supporting and sustaining the program.
For North River’s5,000-person workforce, the Year 1 investment looks like this (based on Sologic’s 2025 price table):
Apprentice Training – $200/person × 5,000 employees = $1,000,000
Specialist Training – $850/person × 500 employees = $425,000
Master Training – $850/person × 50 employees = $42,500
Executive Training – $250/person × 50 leaders = $12,500
Consulting Support – $450/hour × 750 hours = $337,500
Causelink Software – annual subscription = $160,000
Program Champion – internal role allocation (salary already in budget)
Total Year 1 Investment:$1,977,500— just0.09% of revenue.
In future years, the cost drops to roughly $400K for refresher training, onboarding new hires, and ongoing software and support.
And remember — organizations are already spending money on “solutions” today, even without a formal learning program. Repairs, recovery efforts, cleanup, and patchwork fixes are all part of the annual budget, often hidden in operational or maintenance line items. The difference is that without structured learning, these fixes tend to be reactive, short-term, and aimed at getting things running again — not at reducing future risk.
A formal organizational learning effort changes that equation. Some fixes may require higher upfront investment — engineering controls, substitutions, or even full elimination of hazards — but these are targeted, data-driven improvements that dramatically reduce recurrence. Over time, this means fewer emergencies, less rework, and far more value from every dollar spent.
The ROI Model
Over five years, North River invests $3.44 million in building and sustaining an organizational learning capability:
Year 1: $1.81M to stand up the program (training, software, consulting)
Years 2–5: ~$400K/year for refresher training, turnover, and ongoing support
Our model assumes a conservative 15% annual reduction in problem burden— driven by better solutions, more effective prevention, fewer repeat failures, improved cross-department communication, identifying risks before they manifest, and even learning from positive outcomes.
We could calculate ROI using only the actual impacts— and still show a powerful return. But that approach ignores the risk, or “potential blast radius,” that every event carries. In reality, the total value of risk reduction is far higher. For a visual reminder, refer back to the radar diagram: the gap between actual and potential impact is where much of the hidden value lives.
The result:
Total 5-year investment: $3.44M
Net savings: $35.6M
ROI: 1,035%
And here’s the kicker — North River likely spends more on coffee than on solving their preventable problems!
Coffee cost at $1/cup:
5,000 employees × 2 cups/day × 240 workdays/year = $2.4M/year
Over 5 years: $12 million
That’s more than three times the cost of the entire learning program over the same period.
To be clear — this isn’t a pitch to start charging employees for coffee. Coffee is culture. It fuels conversations, connection, and collaboration — exactly what a learning program should do for your organization.
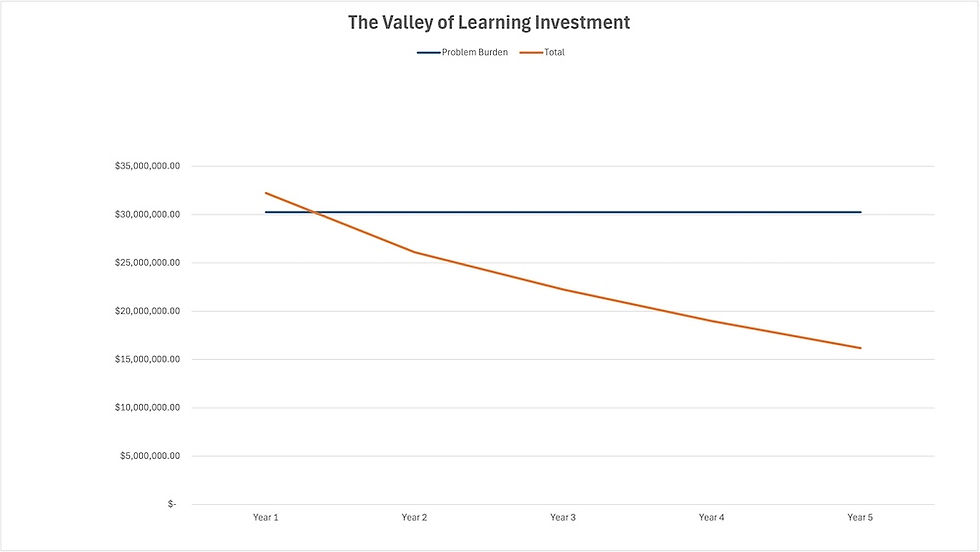
The Valley of Learning Investment
There’s a tricky phase that almost every organization goes through when they commit to building a real learning capability.
Let’s call itthe Valley— that awkward, uncomfortable period where you’re:
Still experiencing the normal volume of failures, incidents, and operational friction from your old, unstructured approach and
Paying for the new proactive capabilities that will eventually reduce those failures.
In other words, you’re spending money on both sides of the risk curve at the same time.
For North River, Year 1 means investing nearly $2M to build capability while absorbing a $30M+ annual problem burden. That’s a tough pill for many executives to swallow — especially when those savings don’t show up instantly.
The key is to remember:
The Valley is temporary.
Each year, the proactive side starts to pay back in the form of measurable reductions in the problem burden.
If you can push through the Valley, the long-term gains in safety, quality, reliability, and efficiency can be transformative.
This is where leadership resolves matters most. If you panic and pull back before the curve bends, you’ve wasted the investment and reinforced the belief that “programs like this don’t work.” If you stay the course, you can shift your organization from firefighting to prevention — permanently.
Already Spending — Just in the Wrong Place
Underinvestment in organizational learning doesn’t mean you’re not spending money. In fact, most organizations are already making significant “investments” — they’re just doing it on the back side of the risk curve, after the damage is done.
That means:
Solutions rushed into place because they’re cheap and easy — but lacking the depth to prevent recurrence, making them ineffective in the long term.
Loss of credibility as improvement efforts get labeled “flavor of the day.”
Opportunity costs as teams spend their time reacting, reworking, and catching up instead of driving forward with innovation and improvement.
We absolutely must investigate adverse events when they occur — but we need to do it in a way that maximizes learning, strengthens prevention, and closes real gaps. And just as importantly, we need to develop the capability to identify and learn from risks before they turn into incidents. That’s where the real leverage is — learning on the front side of the risk curve.
It’s like facing a forest fire with a garden hose — not because we don’t care, but because the investment is in the wrong part of the fight.
Flip the Question
The real question isn’t whether the money will be spent — it will.
The choice is where to spend it.
Both sides of the risk curve matter — we will always need to respond when something goes wrong. But by focusing more resources on the front side of risk — building the capability to prevent and reduce problems — we can shift the balance toward fewer, less costly incidents.
Run the math for your own organization:
Start with your best estimate of the annual cost of safety, environmental, quality, reliability, and production losses.
Add in the hidden costs — reputation hits, regulatory risk, supplier churn, employee turnover.
Then ask: what would a 10–15% annual reduction be worth?
That 10–15% is a conservative number. It doesn’t even begin to account for the qualitative returns — the things that can’t be counted, but certainly count: greater trust, stronger culture, improved collaboration, and a shared sense of purpose.


Comments